-
Home
- Integrations
Datadog Integration
Hardware Sentry integrates seamlessly with your Datadog environment. The Hardware Sentry app, available through the Datadog marketplace, includes a collection of dashboards and monitors designed to collect and expose observability and sustainability data for your IT infrastructure in a turn-key solution.
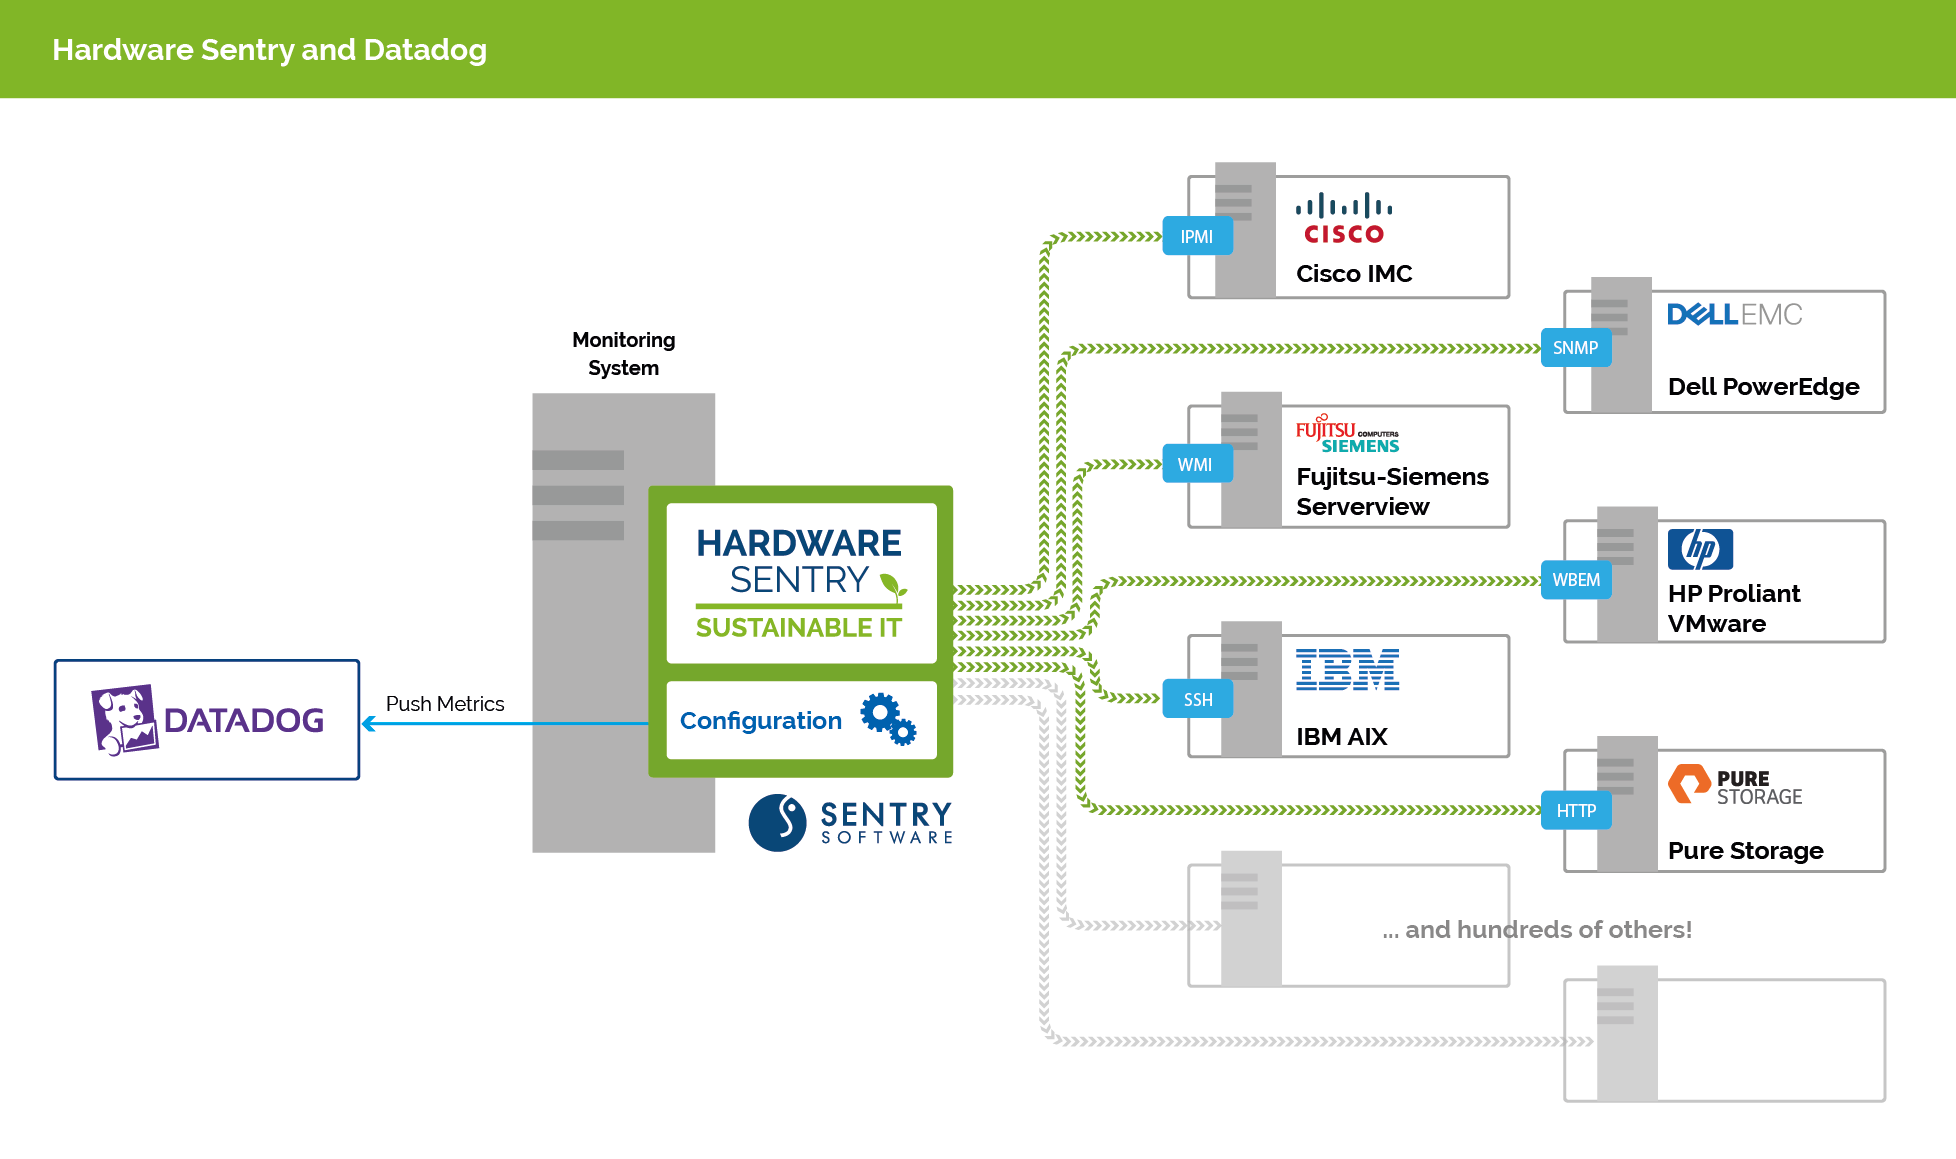
Integrating Hardware Sentry with your Datadog SaaS platform only requires a few installation and configuration steps.
Prerequisites
Before you can start viewing the metrics collected by Hardware Sentry in Datadog, you must have:
- Subscribed to Hardware Sentry from the Datadog Marketplace
- Created an API key in Datadog as explained in the Datadog User Documentation
- Installed Hardware Sentry on one or more systems that has network access to the physical servers, switches and storage systems you need to monitor. It is recommended to dedicate one collector per site, or data center, or server room, etc.
Configuring the integration
Pushing metrics to Datadog
-
Browse to open the Hardware Sentry configuration directory for the OpenTelemetry Collector (
hws/otelby default) and open theotel-config.yamlconfiguration file. -
Find the
exporterssection and edit it as follows:exporters: # Datadog # <https://github.com/open-telemetry/opentelemetry-collector-contrib/tree/main/exporter/datadogexporter> datadog/api: api: key: <apikey> # site: datadoghq.eu # Specify the Datadog site you are on (datadoghq.com for the US (default), datadoghq.eu for Europe, ddog-gov.com for Governement sites). Refer to https://docs.datadoghq.com/getting_started/site/ for more details. metrics: resource_attributes_as_tags: true # IMPORTANTwhere
<apikey>corresponds to your Datadog API key. -
Declare the exporter in the
pipelinessection as follows:service: pipelines: metrics: exporters: [datadog/api] # Datadog must be listed here -
Restart Hardware Sentry to apply your changes.
Refer to Configuring the OpenTelemetry Collector for more details.
Configuring site and sustainability settings
A site represents the data center or the server room in which all the systems to be monitored are located. Configure your site in the extraLabels section of the config/hws-config.yaml file as shown in the example below:
extraLabels:
  site: boston
You also need to update the extraMetrics section as shown in the example below to allow Hardware Sentry to calculate the electricity costs and the carbon footprint of your site:
extraMetrics:
  hw.site.carbon_intensity: 350 # in g/kWh
  hw.site.electricity_cost: 0.12 # in $/kWh
  hw.site.pue: 1.8
where:
hw.site.carbon_intensityis the carbon intensity in grams per kiloWatthour. This information is required to calculate the carbon emissions of your IT infrastructure. The carbon intensity corresponds to the amount of CO₂ emissions produced per kWh of electricity and varies depending on the country and the region where the data center is located. See the electricityMap Web site for reference.hw.site.electricity_costis the electricity price in the currency of your choice per kiloWattHour. This information is required to calculate the energy cost of your IT infrastructure. Refer to your energy contract to know the tariff by kilowatt per hour charged by your supplier or refer to the GlobalPetrolPrices Web site. Make sure to always use the same currency for all instances of Hardware Sentry on all sites to allow cost aggregation in your dashboards that cover multiple sites.hw.site.pueis the Power Usage Effectiveness (PUE) of your site. By default, sites are set with a PUE of 1.8, which is the average value for typical data centers.
Configuring the hosts to be monitored
For each host to be monitored, you need to specify its hostname, type, and protocol to be used in the config/hws-config.yaml file. Refer to Configuring the Hardware Sentry Agent for more details.
Adding monitors
To be notified in Datadog about any hardware failure, go to Monitors > New Monitor and add all the Recommended monitors for Hardware Sentry.
Creating your own monitors based on the ones listed as recommended allows you to customize the notification settings of each monitor.
Using the Hardware Sentry dashboards
Hardware Sentry comes with the following dashboards which leverage the metrics collected by Hardware Sentry:
| Dashboard | Description |
|---|---|
| Hardware Sentry - Main | Overview of all monitored hosts, with a focus on sustainability |
| Hardware Sentry - Site | Metrics associated to one site (a data center or a server room) and its monitored hosts |
| Hardware Sentry - Host | Metrics associated to one host and its internal devices |
They allow you to perform the operations described below.
Detecting monitoring configuration problems
The Coverage widget available in the Hardware Sentry - Main dashboard indicates the percentage of hosts configured that are actually monitored.
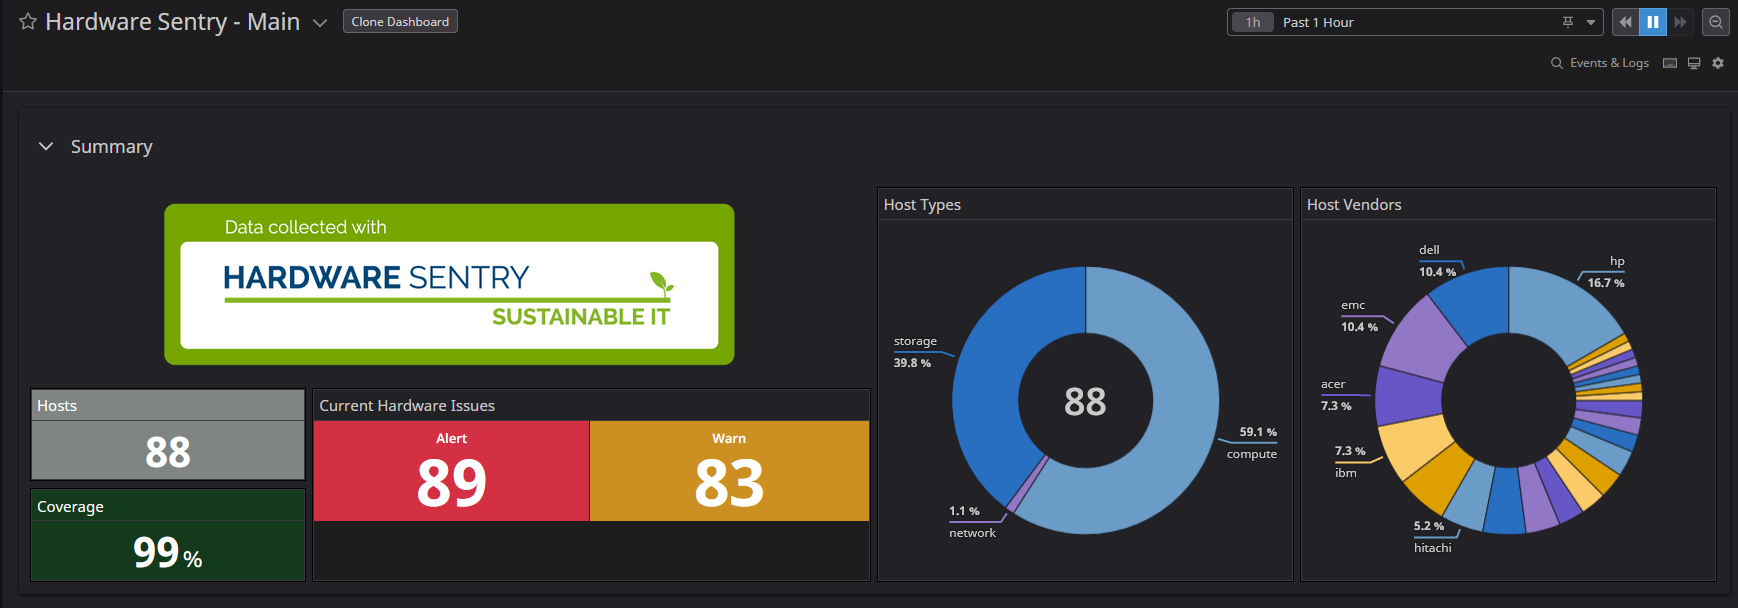
If the coverage is below 100%, verify that your hosts are properly configured in the config/hws-config.yaml file.
You can also check the Hardware Sentry Agents Information widget at the bottom of the Hardware Sentry - Main dashboard to ensure your Hardware Sentry Agents in charge of collecting data are up and running.

Detecting and troubleshooting hardware failures
The Current Hardware Issues widget available in all dashboards displays the number of alerts and warnings triggered.
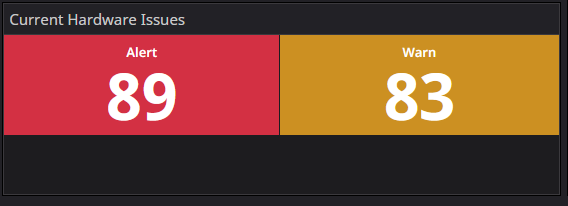
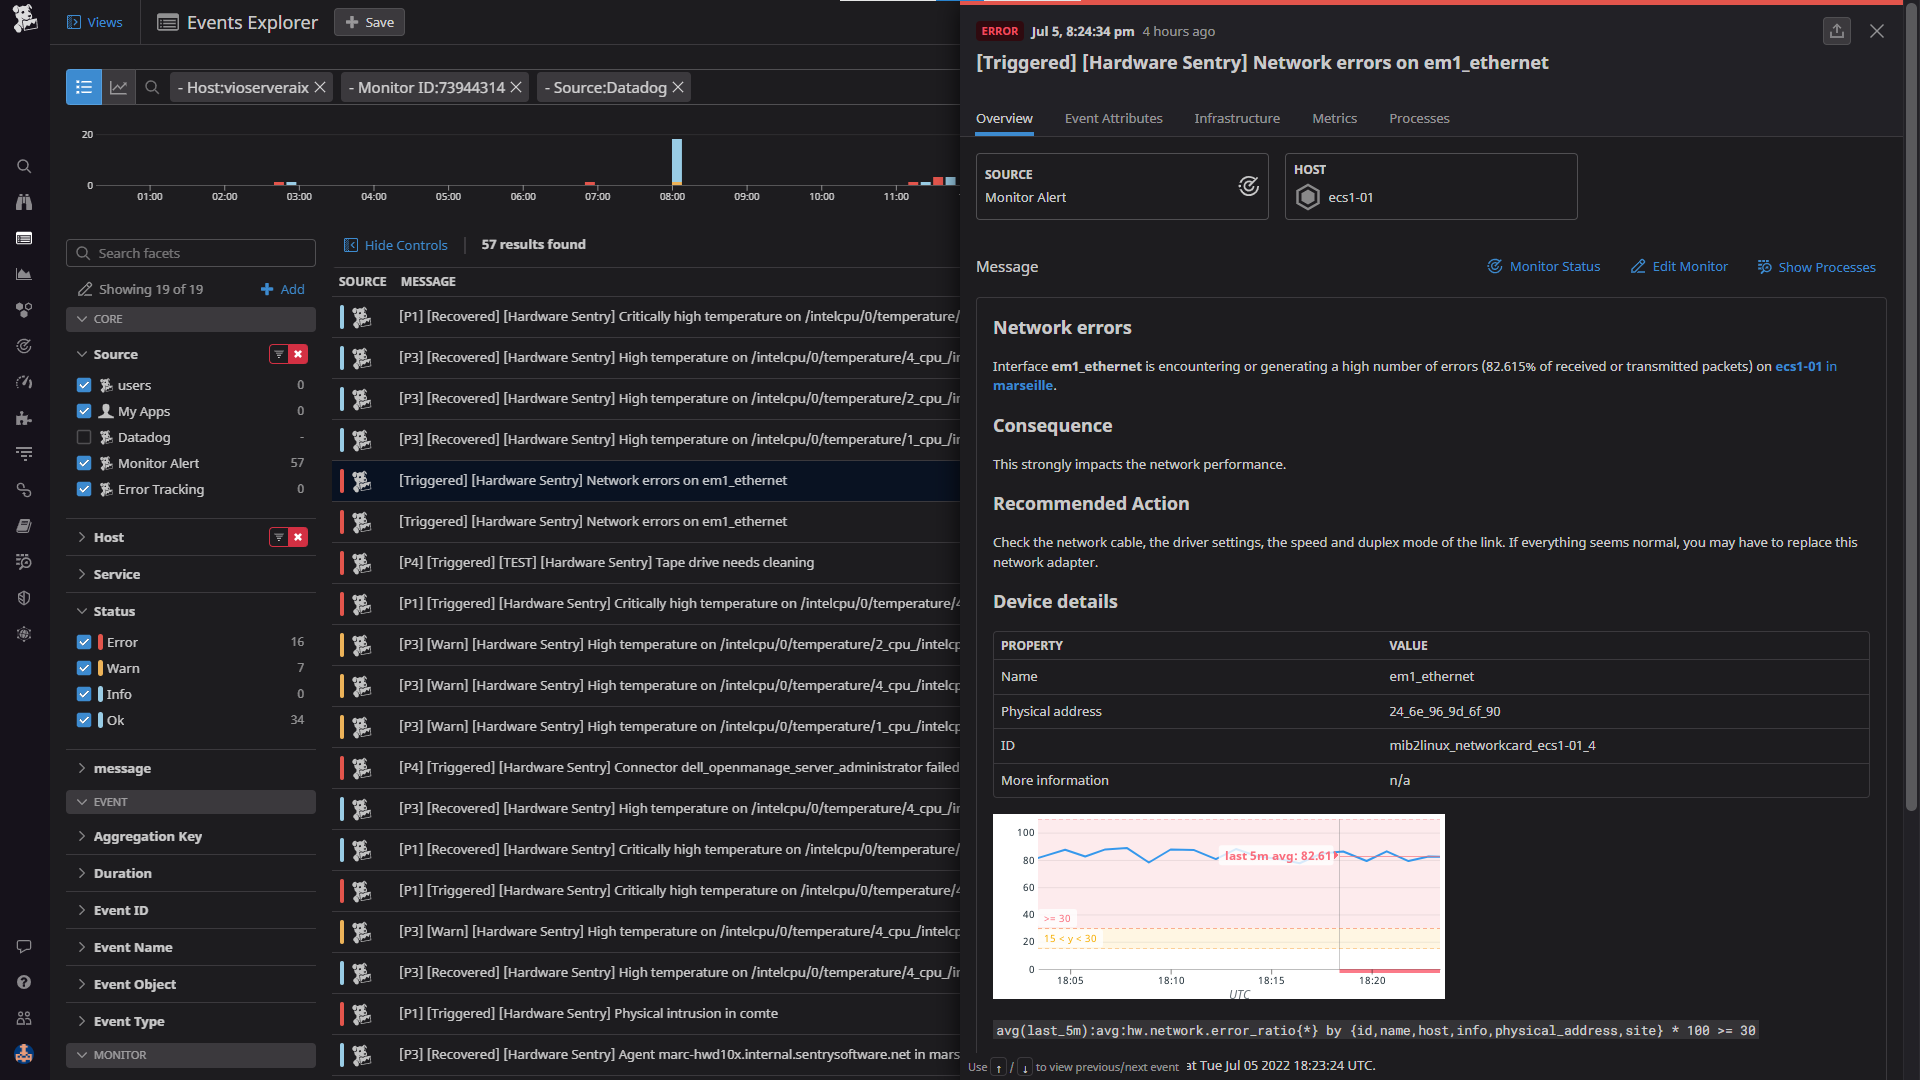
Click the Alert or Warn widget to access the Triggered Monitors page. Click a monitor to get more details about the failure:
Estimating the energy usage and carbon footprint of your infrastructure
After collecting metrics for a few hours, Hardware Sentry can estimate the power consumption, energy costs, and carbon emissions of your overall IT infrastructure, sites and even hosts on a daily, monthly, and yearly basis.

The Margin of Error indicates the percentage of error in the estimate. A lower value means a more accurate estimation.
Hardware Sentry also reports the power consumption, energy costs, the CO₂ emissions of each monitored host in the corresponding Hardware Sentry - Host dashboard:

The Power per Device Type widget provides an estimation about the power consumed by the internal components of the monitored host.
Comparing the efficiency and environmental impact of your sites
The Power, Cost and CO₂ Emissions widget available in the Hardware Sentry - Main dashboard allows you to quickly identify which of your sites:
- is the most energy-intensive (Yearly Energy Usage (Wh))
- has the highest energy costs (Yearly Cost ($))
- is the most harmful for the environment (Yearly CO₂ Emissions (tons)).

To find the first responses to your questions, refer to the Sites widget of the Hardware Sentry - Main dashboard as it provides:
- the number of hosts composing the site. A bigger site would logically consume more energy than a smaller one
- the ambient temperature and heating margin of each site. You can consider increasing the temperature of a site by a few degrees if its ambient temperature is particularly low compared to the ASHRAE recommendations and if you have an acceptable heating margin.

If you want to follow the temperature optimization lead, click the site to open the corresponding Hardware Sentry - Site dashboard and navigate to the Site Temperature Optimization widget:

The Site Temperature Optimization widget exposes the heating margin at the site (Heating Margin) and hosts levels (Heating Margin Host Distribution ) as well as its evolution over time (Site Heating Margin (°C) widget). But this widget is particularly interesting to estimate the savings you could make if you increase the temperature of your site to the Recommended Site Temperature and how you could significantly reduce its carbon footprint.
Note that the accuracy of the estimated values increases proportionally with the Monitoring Confidence percentage. That percentage is based on the number of hosts reporting temperature readings. The more hosts report readings, the higher the monitoring confidence is.
Detecting overheating risks for hosts
The Heating Information widget available in the Hardware Sentry - Main dashboard allows you to quickly identify the hosts that are at the risk of overheating. Each temperature sensor is individually monitored and exposed in a color-coding system. Warm colors indicate that hosts will soon reach their thermal limit:
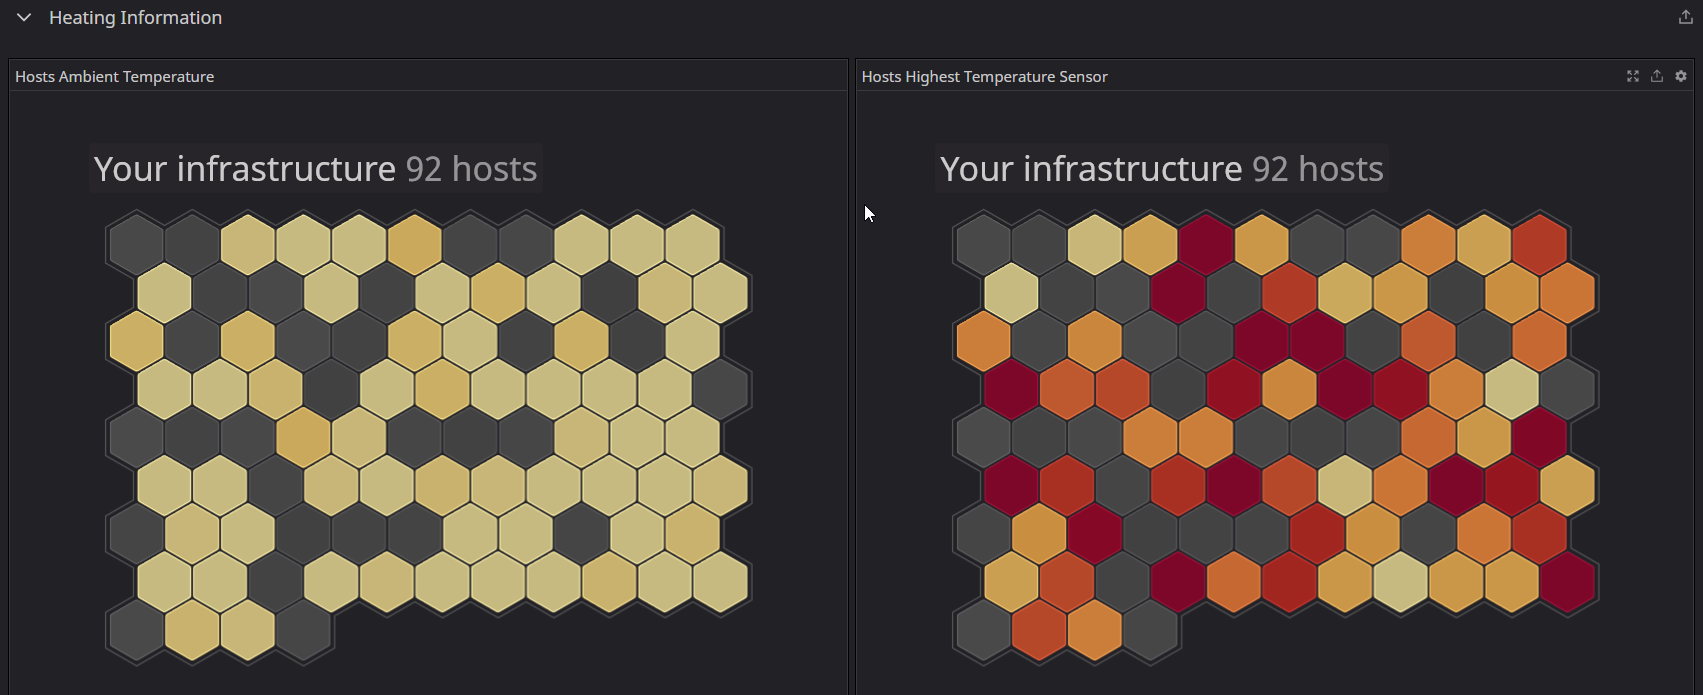
Click the host to access its details.
Observing the hardware health and environmental impact of the monitored hosts
The Hardware Sentry - Host dashboard summarizes the essential hardware health and sustainability data available for the monitored host. You can access it from the list of hosts in the Hardware Sentry - Sites dashboard: click on a host > View hardware dashboard.
This dashboard includes:
- the status of its internal components
- the network traffic
- the storage usage
- the power consumption and related carbon emissions
- the temperature information
- etc.
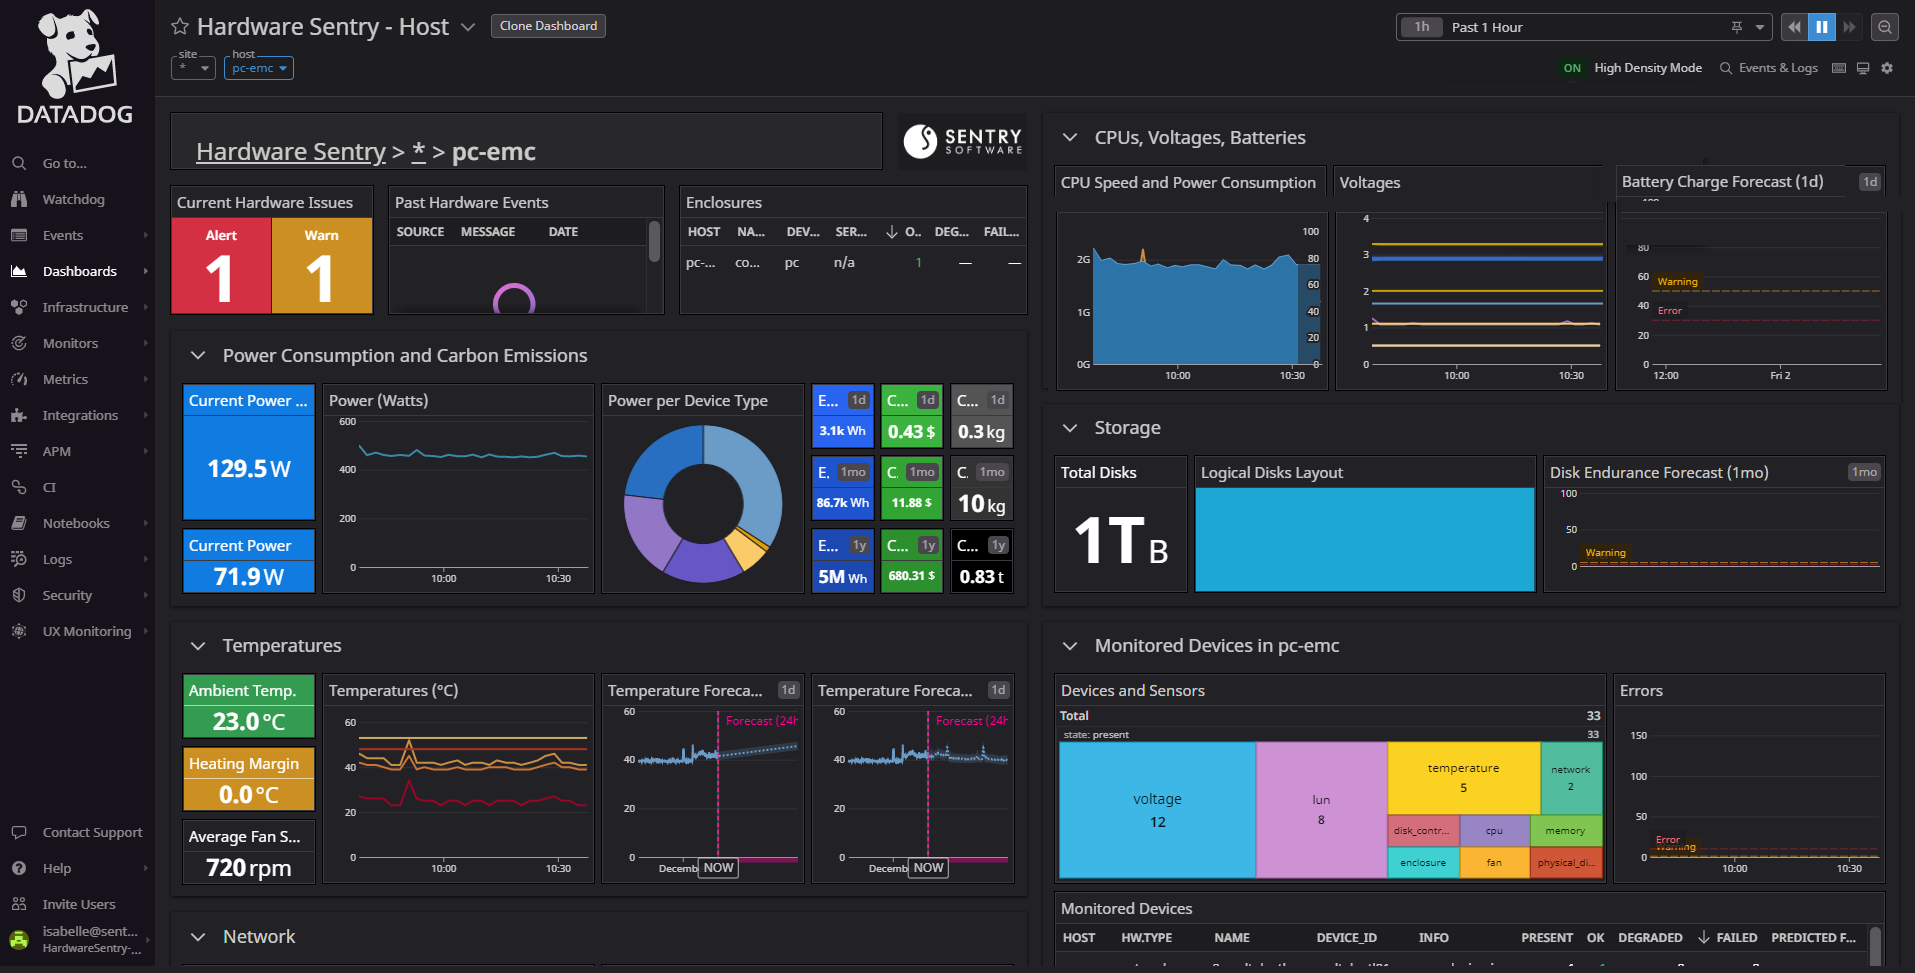
Information about the monitoring itself (host information, connectors used, etc.) is provided in the Monitoring Information section.
