Integrating Hardware Sentry with Prometheus & Grafana
Observing hardware and sustainability critical information across your entire IT infrastructure in one place.Prometheus is an open-source monitoring system and time-series database that monitors and collect event data in your IT infrastructure.
Grafana is an open-source visualization and analytics software that exposes time-series data into graphs and visualizations.
Hardware Sentry integrates seamlessly with Prometheus and Grafana to translate time-series metrics into an easily readable picture of your environment.


Book a demo with one of our experts
Key Features

hardware monitoring
Hardware Sentry detects and even predicts failures in processors, memory modules, disks, network cards, controllers, power supplies, fans, temperature sensors, etc.

it energy usage reports
No smart PDUs required: Hardware Sentry is a pure-software solution capable of reporting the power consumption of all monitored systems, even those which are not equipped with power sensors.

CO₂ emissions reports
Hardware Sentry combines the energy usage of each monitored systems with the electricity cost and carbon density provided to produce accurate CO₂ emissions reports for your different sites.

data center temperature optimization
Hardware Sentry analyses the temperature of your different hosts to recommend an ambient temperature optimum for your server rooms and estimates the amount saved when this recommendation is followed.
Easy set up and configuration
Integrating Hardware Sentry with your operational Prometheus Server and Grafana platform only requires a few installation and configuration steps:
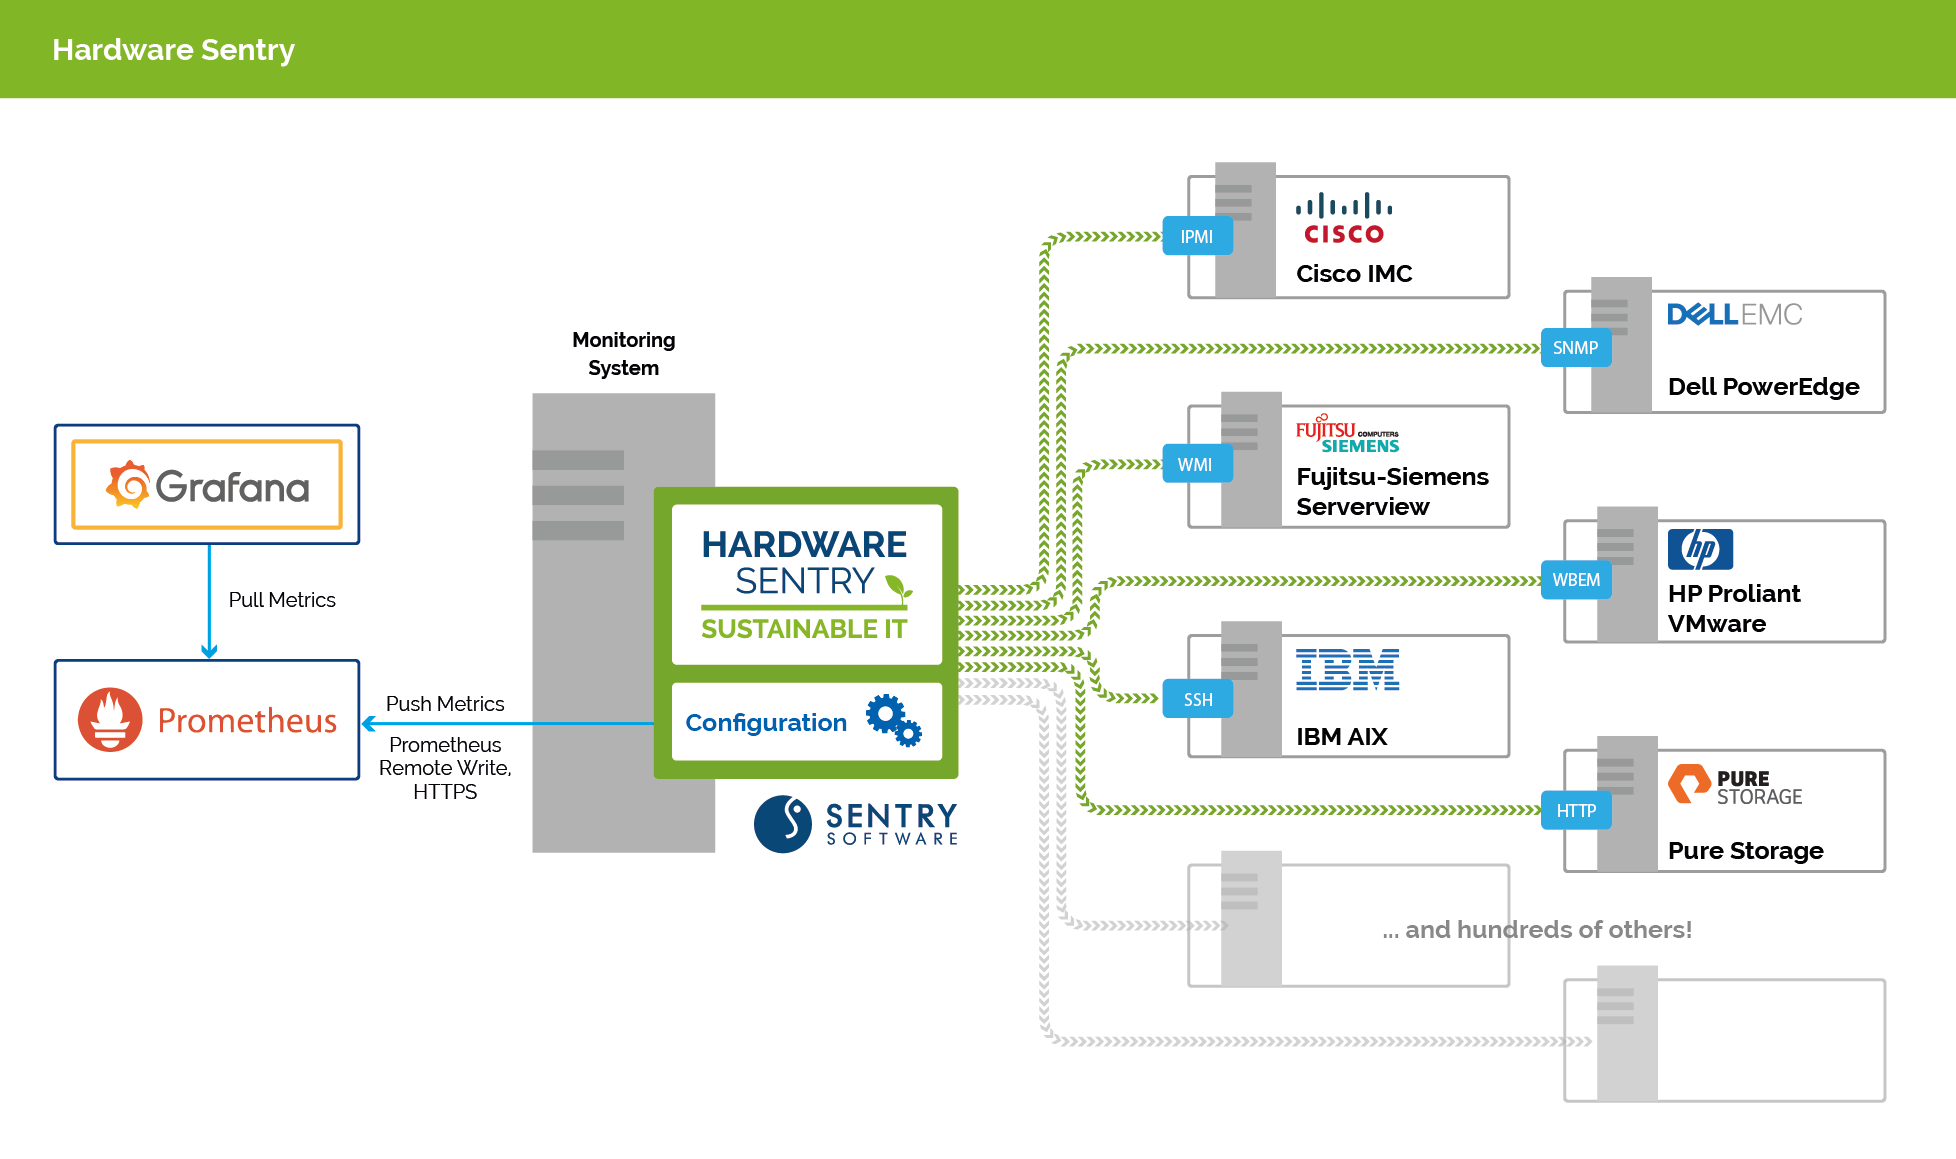
Architecture Diagram
Integrate Hardware Sentry with Prometheus and Grafana to expose hardware health, performance, and sustainability metrics to Prometheus Server and turn observability data into actionable alerts in Grafana to help on-call responders resolve issues quickly.